Interactive Data Visualisation with Light
Interactive Data Visualisation with Light
Washington, USA, 2020

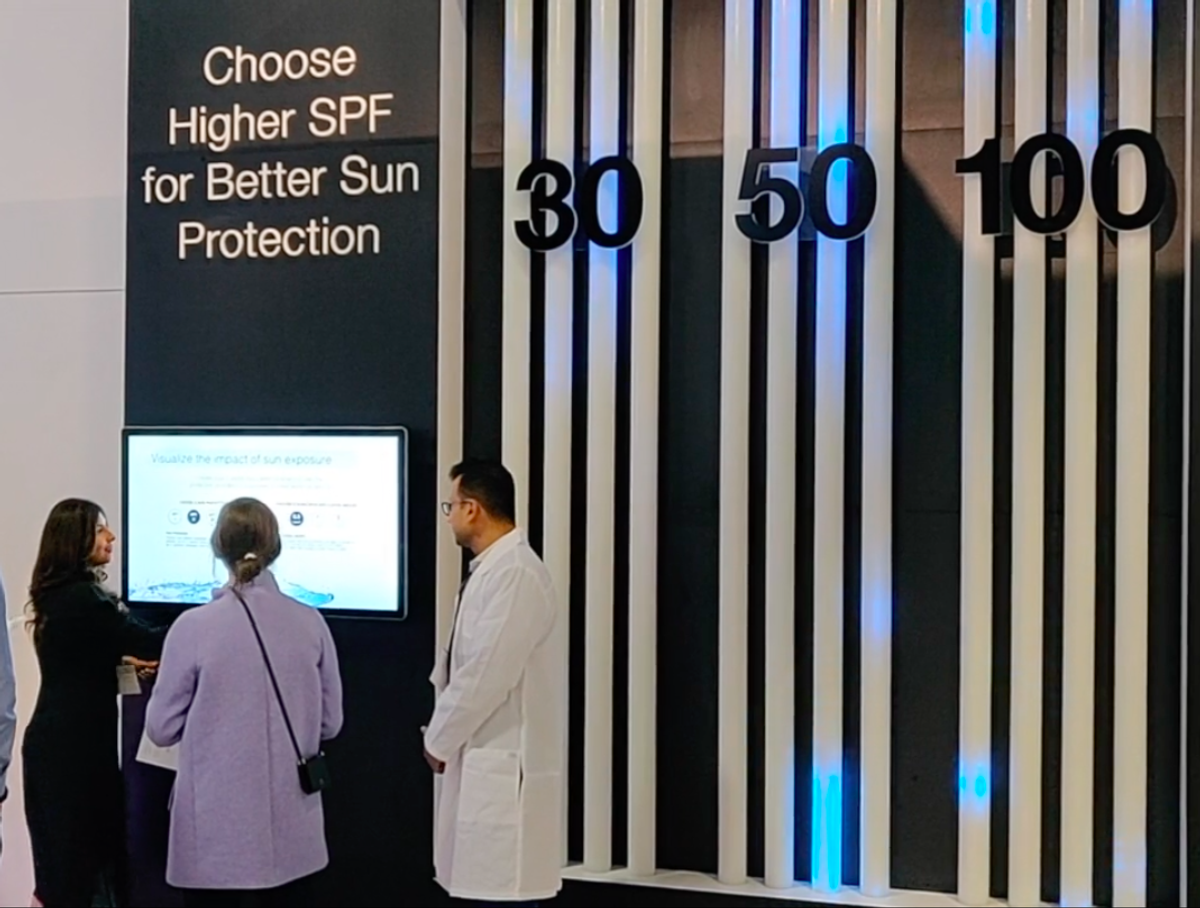
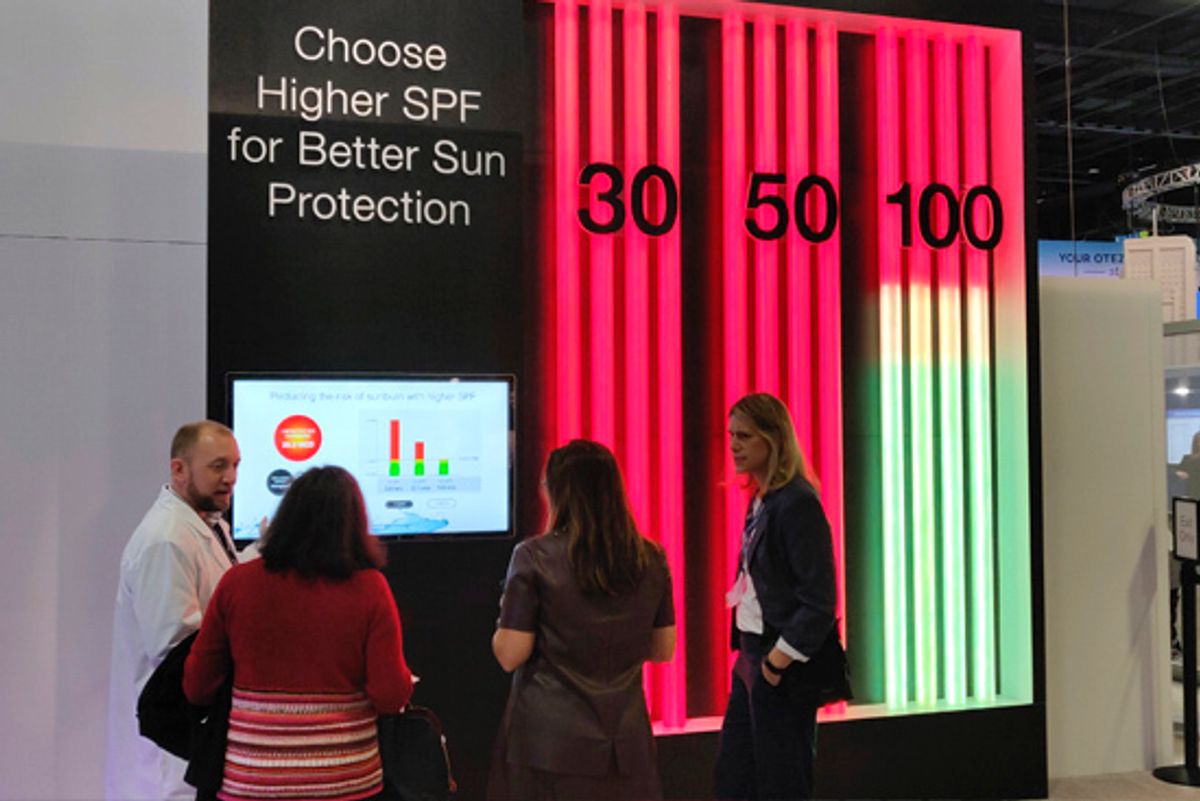
How to display scientific data using light? For that purpose the studio developed an interactive lighting installation, that visualises skin data in an immersive experience, using Protopixel technology and touchscreens.


Credits
- Client:
- Design:
- Photos and Video: ProtoPixel and